
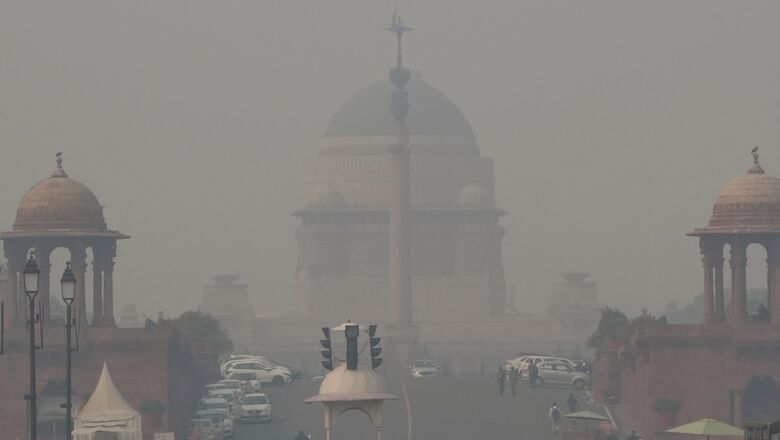
Five years into the launch of the government’s ambitious National Clean Air Programme (NCAP), air pollution levels in most Indian cities still exceed national standards and fare worse in terms of WHO’s globally recognised air quality guidelines, shows a new report.
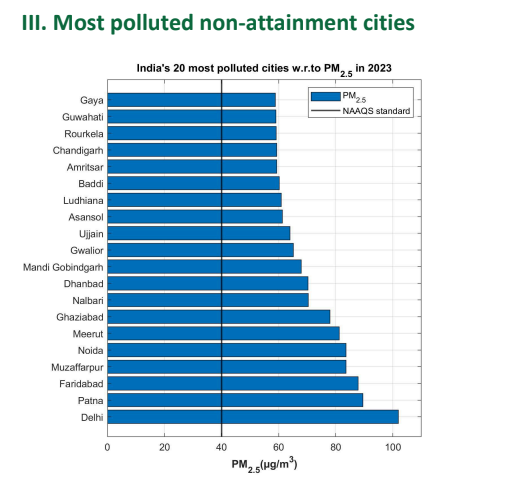
Delhi, which remains one of the most polluted cities in the world, recorded the highest PM2.5 levels of 102 μg/m3 yet again in 2023, an increase of 2.5% compared to 2022. While the national capital continued to top the list, it is closely followed by Patna which also recorded the highest PM10 levels in 2023, worse than the 2019 levels.
The ambitious programme NCAP was launched in 2019 to bring down Particulate Matter (PM10 and PM2.5) concentration by 20-30% by 2024 (compared to 2017) in 131 non-attainment cities which did not meet the National Ambient Air Quality Standards (NAAQS) between 2011 and 2015. However, this target was later revised to 40% by 2026. Over Rs 9,650 crore has already been released to these cities, and 60% of it has been utilised by the urban local bodies.
But as air pollution becomes a growing health emergency, the assessment of the last five years shows that air remains poor in most Indian cities. Though the PM10 and PM2.5 concentrations have fallen to varying levels in 27 cities, the current levels are still way past WHO’s safe limits, which are way more stringent than India’s benchmarks.
DELHI AND PATNA MOST POLLUTED, HIGH PM2.5 LEVELS
According to the analysis done by New Delhi-based Climate Trends and Respirer Living Sciences, Delhi and Patna remained the most polluted, but PM2.5 concentrations also increased in Navi Mumbai (46%), Ujjain (46%) and Mumbai (38%) since 2019. Similarly, for PM10, Durgapur, Thane, and Mumbai show an increase of 53%, 46% and 36%, respectively.

Except for Guwahati and Rourkela, 18 of the top 20 cities, with the highest PM2.5 levels in 2023 are clustered in the Indo-Gangetic Plains (IGP). Similarly, for PM10, 14 of the top 20 cities in 2023 are in the Indo-Gangetic Plains. The rest are Surat, Visakhapatnam, Rourkela, Thane, Guwahati and Badlapur. PM2.5 (less than 2.5 micrometres in diameter) is the most dangerous pollutant as it can penetrate lungs and enter the bloodstream, causing cardiovascular and respiratory diseases, and cancers.
“There is a notable reduction in PM2.5 and PM10 levels in top polluted cities. Despite these positive strides, persistent challenges exist, with some urban areas facing an uptick in pollution concentrations. As cities add new air quality monitoring stations, strengthened monitoring will give a better picture of the problem and allow for better mitigation measures. These must feed into the next phase of the NCAP and sustained efforts must continue for achieving nationwide cleaner air,” said Aarti Khosla, Director, Climate Trends.
The analysis is based on five years of data from the Continuous Ambient Air Quality Monitoring Stations (CAAQMS) installed by the Central Pollution Control Board (CPCB) in some 99 non-attainment cities, and manual monitoring stations in others. In terms of PM2.5, the data was available for only 49 cities and out of these, 27 cities showed improved PM2.5 levels in the last five years. Similarly, for PM10, data across five years was available for 46 cities. Of these, 24 cities saw an improvement in their PM10 levels.
DEMAND FOR BETTER AIR QUALITY STANDARDS UNDER NCAP 2.0
As per the data, Varanasi, Kanpur, Meerut and Lucknow in Uttar Pradesh as well Jodhpur in Rajasthan seem to have achieved a significant reduction in PM2.5 and PM10 levels. The PM concentrations also improved significantly in Talcher (Odisha), and Kalaburagi (Karnataka). All these cities also saw an uptick in the number of active monitoring stations, improving the data significantly. It is important to note that the air quality is also greatly influenced by its geographical location and meteorological factors, as emission sources.
However, a major concern is that even though all the least-polluted cities recorded PM2.5 levels within the ‘good’ category (0-30 μg/m3) or met the CPCB’s annual average safe limit of 30 μg/m3, their levels are worse compared to the World Health Organization’s (WHO’s) annual average safe limit of 5 μg/m3. All cities surpass the WHO threshold, highlighting the ongoing challenges in achieving internationally recognized air quality standards.
“We are bearing a high cost of air pollution on the health of people. There are cities where pollution levels are not falling fast enough, and are, in fact, rising. For NCAP 2.0, we should try to revise our national air quality standards to at least meet the interim targets of WHO – 35-25 µg/m3 annual mean. Reducing vehicular pollution needs to be a main thrust area in cities. Electrification of public transport systems is underway in some metro cities, but a lot more needs to be done, especially to make people prefer public transport over private vehicles,” said Dr R Subramanian, Sector Head – Air Quality at C-STEP.
Experts underscored the need for more stringent regulatory frameworks to step up action. India’s current annual average safe limits for PM2.5 is 40 ug/m 3, while it is 60 ug/m3 for PM10, worse than WHO’s safe limits which state that the annual average concentrations of PM2.5 should not exceed 5 µg/m3.


Comments
0 comment