views
Calculating the Average Age
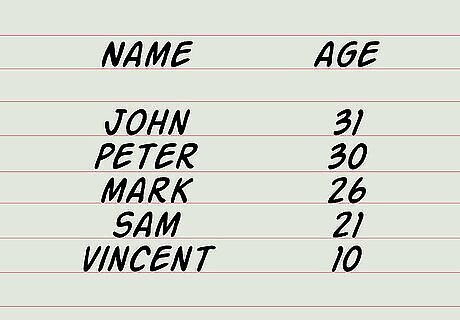
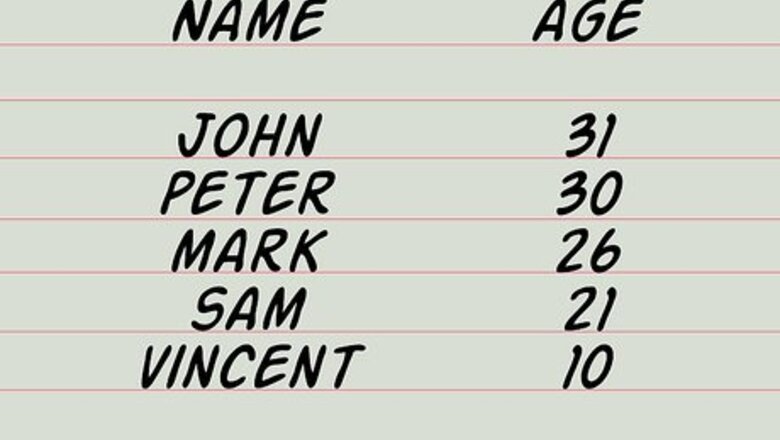
Organize all of the ages in a list. Figuring out the average of something is simple. It means that you take every single number in the list. Write them down or put them in a spreadsheet.
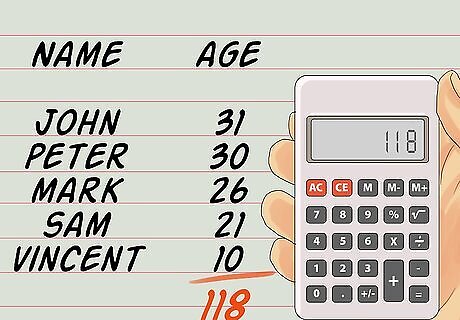
Find the sum of all of the ages on the list. That means that you add them all up for a grand total. Let’s say you have 5 ages: 31, 30, 26, 21, 10. The total or sum of those numbers is 118.
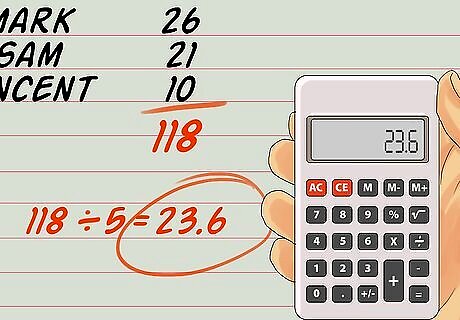
Now, divide the sum you got by the number of ages in the list. That’s the average. Using the above example, you would divide 118 (the sum of all the ages) by 5 (the number of ages in the list). The average age is 23.6. This works for much larger number sets too. For example, let’s say you wanted to find the average age of people in a club. Let’s say there were 100 members in the club. You would need the exact ages of each club member. You would add those ages together to get a sum. Then, you would divide that sum by the number 100. That’s the average age of members in the club.

Find the average of other sets of numbers. It’s no different when calculating average for other types of numbers that aren't ages. Average works the same way. For example, let’s say you want to know the average population of the 10 largest cities in America. You would list the population for each city. Then, you would add all of those numbers up. You would divide the sum by 10, and that’s the average. There are times you might want to use a weighted average. For example, when averaging a student’s grades, you might want to weigh some assignments as being worth more than others. To do this, multiply each grade by the weight. Then add those numbers together, and divide by the total number of grades
Determining When to Use Average
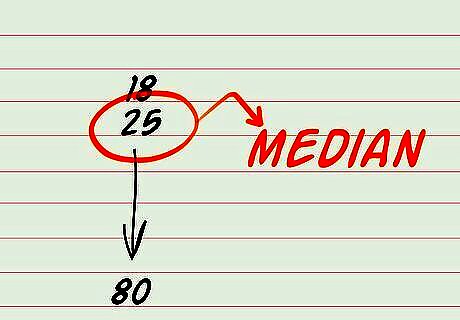
Know the difference between average and median. Sometimes people are confused by the difference between the average and the median of a set of numbers. There are times that the median can be a better number to use than the average, actually. The median means the midpoint number in the data. It means the number (in this case age) that appears exactly in the middle.. Median might be a better assessment of the group’s age if there is an outlier in the group. Let’s say every student in a college class of 20 is between the ages of 18-25, but there is a single older returning student who is 80. If you calculated the average, the much older student would skew the average upward making the class look older than it really is. If you selected the number at the midpoint of all the ages on a list, it would be a closer representation of the class. So, use median if there is an extreme outlier on your list.
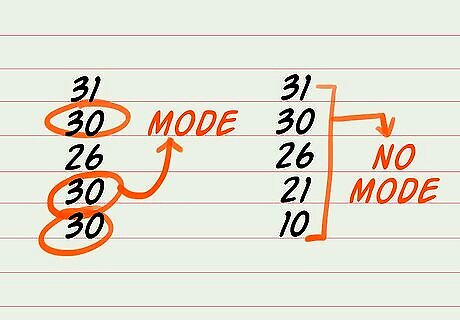
Realize how mode differs from mean or average. Mode is different; that means the number that appears most frequently in the data. Mean is the same thing as average. It’s just another word used for it. Sometimes the best way to handle numbers is simply to present more than one number, say both median and average. If you’re asked to find the average age but only have age ranges (such as a certain number of people in age range 2-4 and age range 4-6, you would calculate the midpoint number for each range, add those up, and then divide them by the total number in each age range.)
Finding the Average Age with Many Numbers
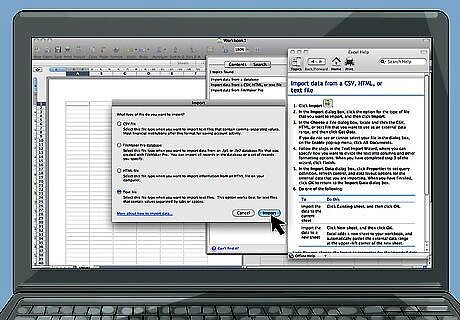
Try using an Excel spreadsheet. If you need to calculate the average from a lengthy list of ages, try putting them into Excel. Otherwise, if you sit there with a calculator or notepad and paper, it could take you a long time. Let’s say for the sake of argument that you needed to calculate the average age of every student in a school or of every person on the payroll of a large company. Those are examples of lists where there would be so many ages that it would be beneficial to use a spreadsheet program like Excel. The first thing you need to do is put the ages in an Excel spreadsheet. Excel is widely available through Microsoft Office package. Either you will need to type the ages into Excel or, better yet, you can import another document containing the ages into Excel. Perhaps the ages are already organized in Excel. To import a text file into Excel, click on "get external data" and the text. Excel will walk you through a wizard to import that data into a spreadsheet
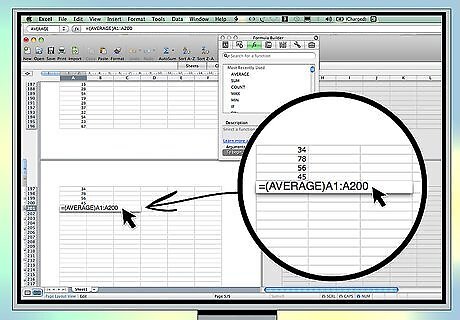
Use the Excel formula for average. Let’s say the ages are listed in column A in Excel. Let’s say they start at row 1 and stop at row 200 (columns are vertical in Excel, and rows are horizontal). To get the average, you need to input the Excel formula for average. You can type it at the bottom of column A. The formula for average in Excel is =(AVERAGE)A1:A200. You need to substitute the column and row coordinates that house the first age in the column for A1. In this example, it would literally be A1, if the first age was listed in the first row in column A. You would need to substitute A200 for the column and row coordinates that house the last age in column A in your own data set. In this example, it was A200 because the last age is housed in column A, row 200. The colon in between tells the computer to add up the age in A1, in A200 and everything in between, and average them. Hit enter, and you should have the average.
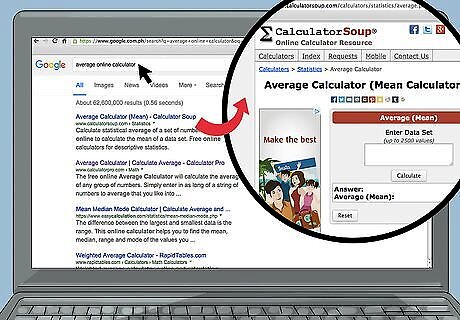
Try using an average calculator. There are websites that will make it easier to calculate average. They provide online calculators in which you put the string of numbers. Of course, a pencil and paper or a regular calculator work too. Once you understand how the formula for average works, you can figure out which tool will get you there.


Comments
0 comment