views
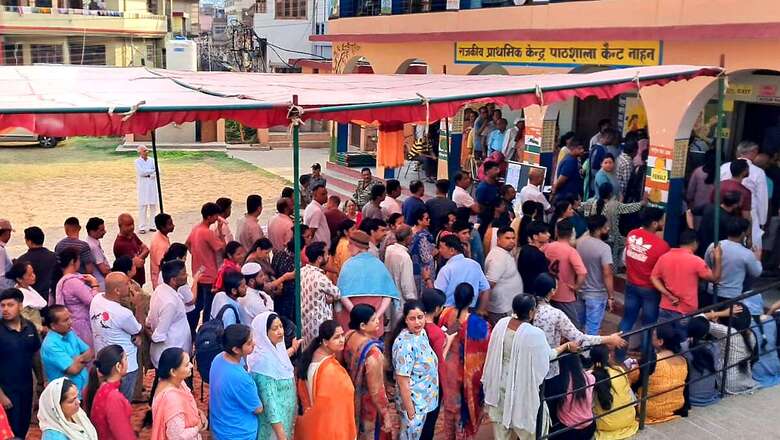
High voter turnout has traditionally understood to signal stronger anti-incumbency, while a more passive turnout is equated with pro-incumbency. While a few elections may have confirmed this notion, an analysis of official data shows the conclusion doesn’t hold true.
General elections held in 1962 and 2014 saw the highest jump in voter turnout when compared to the other years. In 2014, the BJP rose to power ending the two-term run of the Congress. But in 1962, the Congress, which was the party in power was voted for another term.
Similarly, the highest drop in average turnout was reported in 1991 and 1971. The Congress rose to power in 1991 and had retained its control at the Centre in 1971.
Political observers and psephologists have long believed that higher turnout is an indication that voters are unhappy with the incumbent government and are stepping out to vote to change it. On the other hand, if the turnout drops, it’s understood to mean that the public is happy with the current government and doesn’t feel any urge to step out.
This was seen in 2014, when the turnout was 66.4%, over eight percentage points higher than the 2009 turnout of 58.21%. The people voted to change the government, electing the BJP to end the Congress rule. But then in 2019, the voter turnout stood at 67.4%, a little higher than 2014, but the BJP government retained power.
In 2004 and 2009, when the Manmohan Singh-led Congress government came to power, there again did not seem to be any connection between the voter turnout and the election result. Manmohan Singh became prime minister in 2004 when the Congress dethroned the Atal Bihari Vajpayee-headed BJP government. In 2004, the turnout was 58.07%, about two percentage points short of the previous election turnout. But in 2009, when Singh retained power, the turnout was higher than 2004’s at 58.21%.
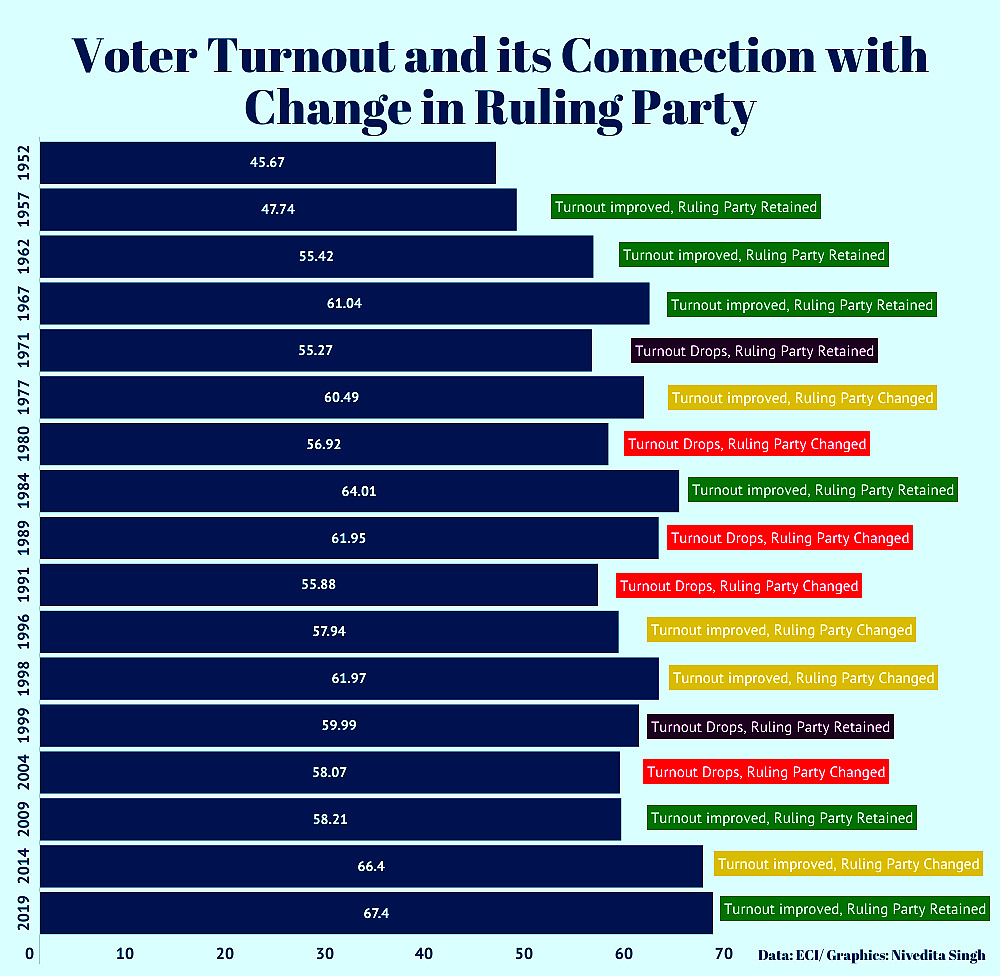
Since 1957, the voter turnout has dropped six times when compared to the previous Lok Sabha polls. At least four of these times, the ruling party at the Centre changed — 1980, 1989, 1991 and 2004. In 1999 and 1971, the voter turnout dropped, but the ruling party retained power.
On the other hand, the turnout in 10 elections increased and only in four of these cases was the ruling party ousted at the Centre — 1977, 1996, 1998 and 2014. In the remaining six cases, the ruling party retained power, recent examples being the 2009 and 2019 elections.
While polling for the seven-phased Lok Sabha elections 2024 ended on Saturday evening, the official voter turnout data has not been released yet. In the 485 seats where elections were held in the first six phases, the average turnout stood at 66.78%, slightly lower than 2019’s (68.46%) for the same seats. Across all the 543 seats, the average turnout in 2019 was 67.4%.
The final voter turnout and its impact on the ruling party will be revealed next week when the Election Commission of India issues the final turnout figures and when counting of votes is held on June 4.
Check detailed seat predictions based on Exit Poll Results 2024 LIVE . Get minute-by-minute updates on the exit polls from Andhra Pradesh.



Comments
0 comment